KPlot
KPlot is useful for plotting many different types of time-domain data. The following file formats are supported:
HDF5 (.hdf5, .h5) - Open source format that is the default output format for Kestrel EMT results
PSCAD (.inf) - PSCAD format results. (Note: Open the .inf file, not .out files)
Siemens/PTI PSS/E (.out) - Dynamic stability plot results from the Siemens/PTI PSS/E program
Comma-Separated Values (.csv) - Widely used generic format for file exchange
KGRID Raw Data (.raw) - Raw voltage waveform data from the KGRID sensor project
KPlot is used to view the HDF5 output files from Kestrel EMT. It can also be used as a general purpose time-domain data viewer. Currently, to view HDF5 files, KPlot is expecting the file structure to match the structure described in the HDF5 Files section of this document.
IMPORTANT NOTE: Because KPlot is developed with EMT simulation data in mind, be cognizant that most features, such as RMS calculations and frequency domain analysis tools are intended to work on time-domain point on wave data.
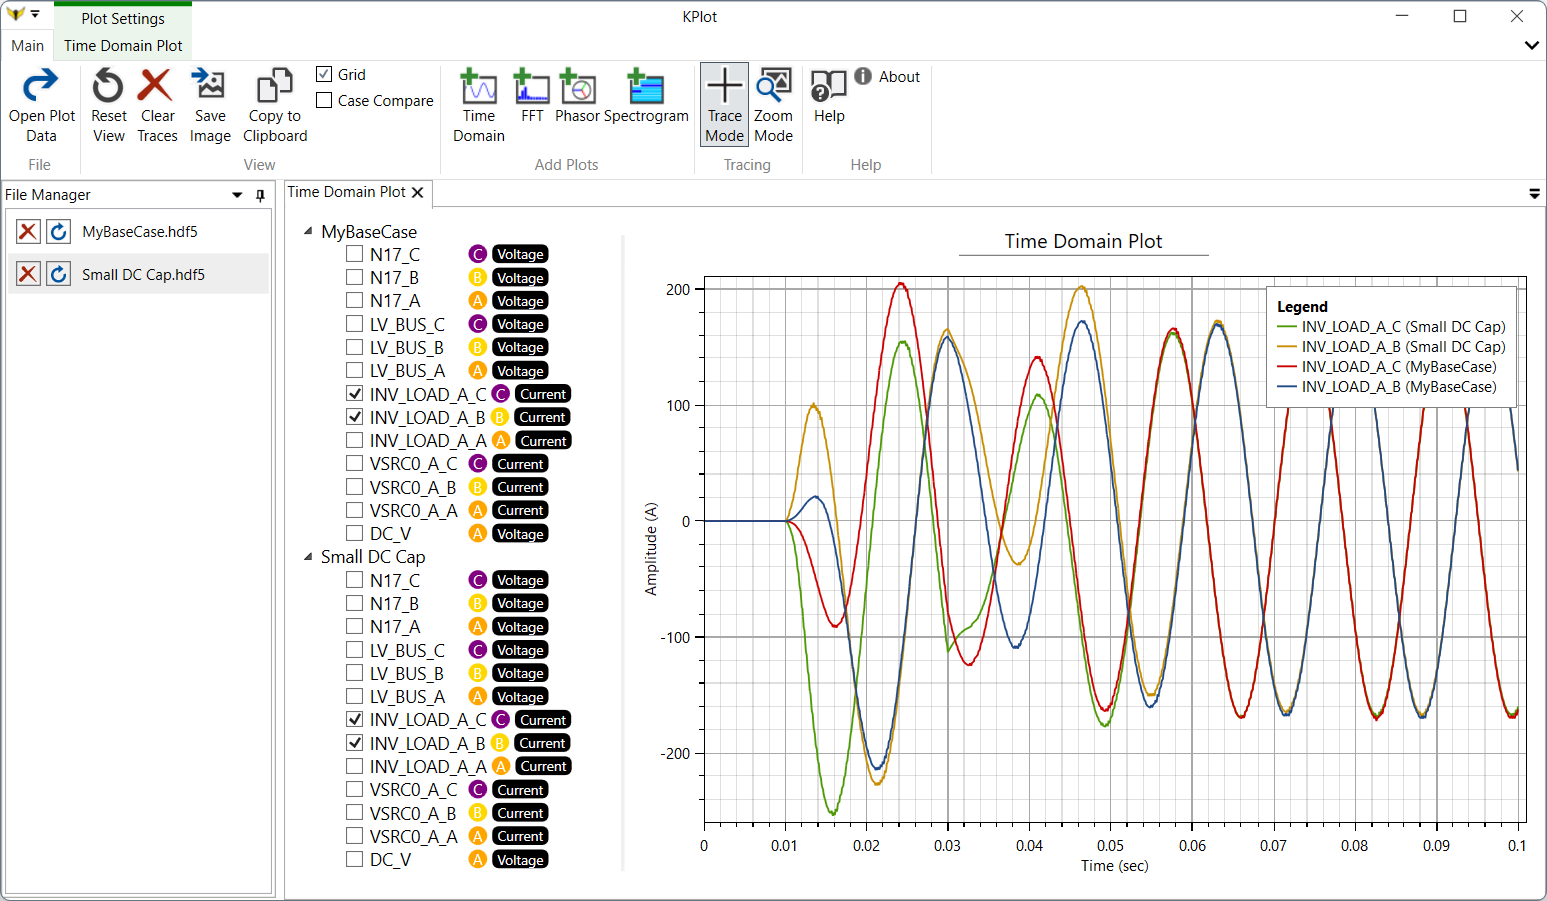
To get started, open an HDF5 file using the Open Plot Data button. By default, a Time Domain Plot will open.
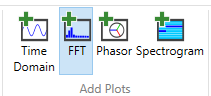
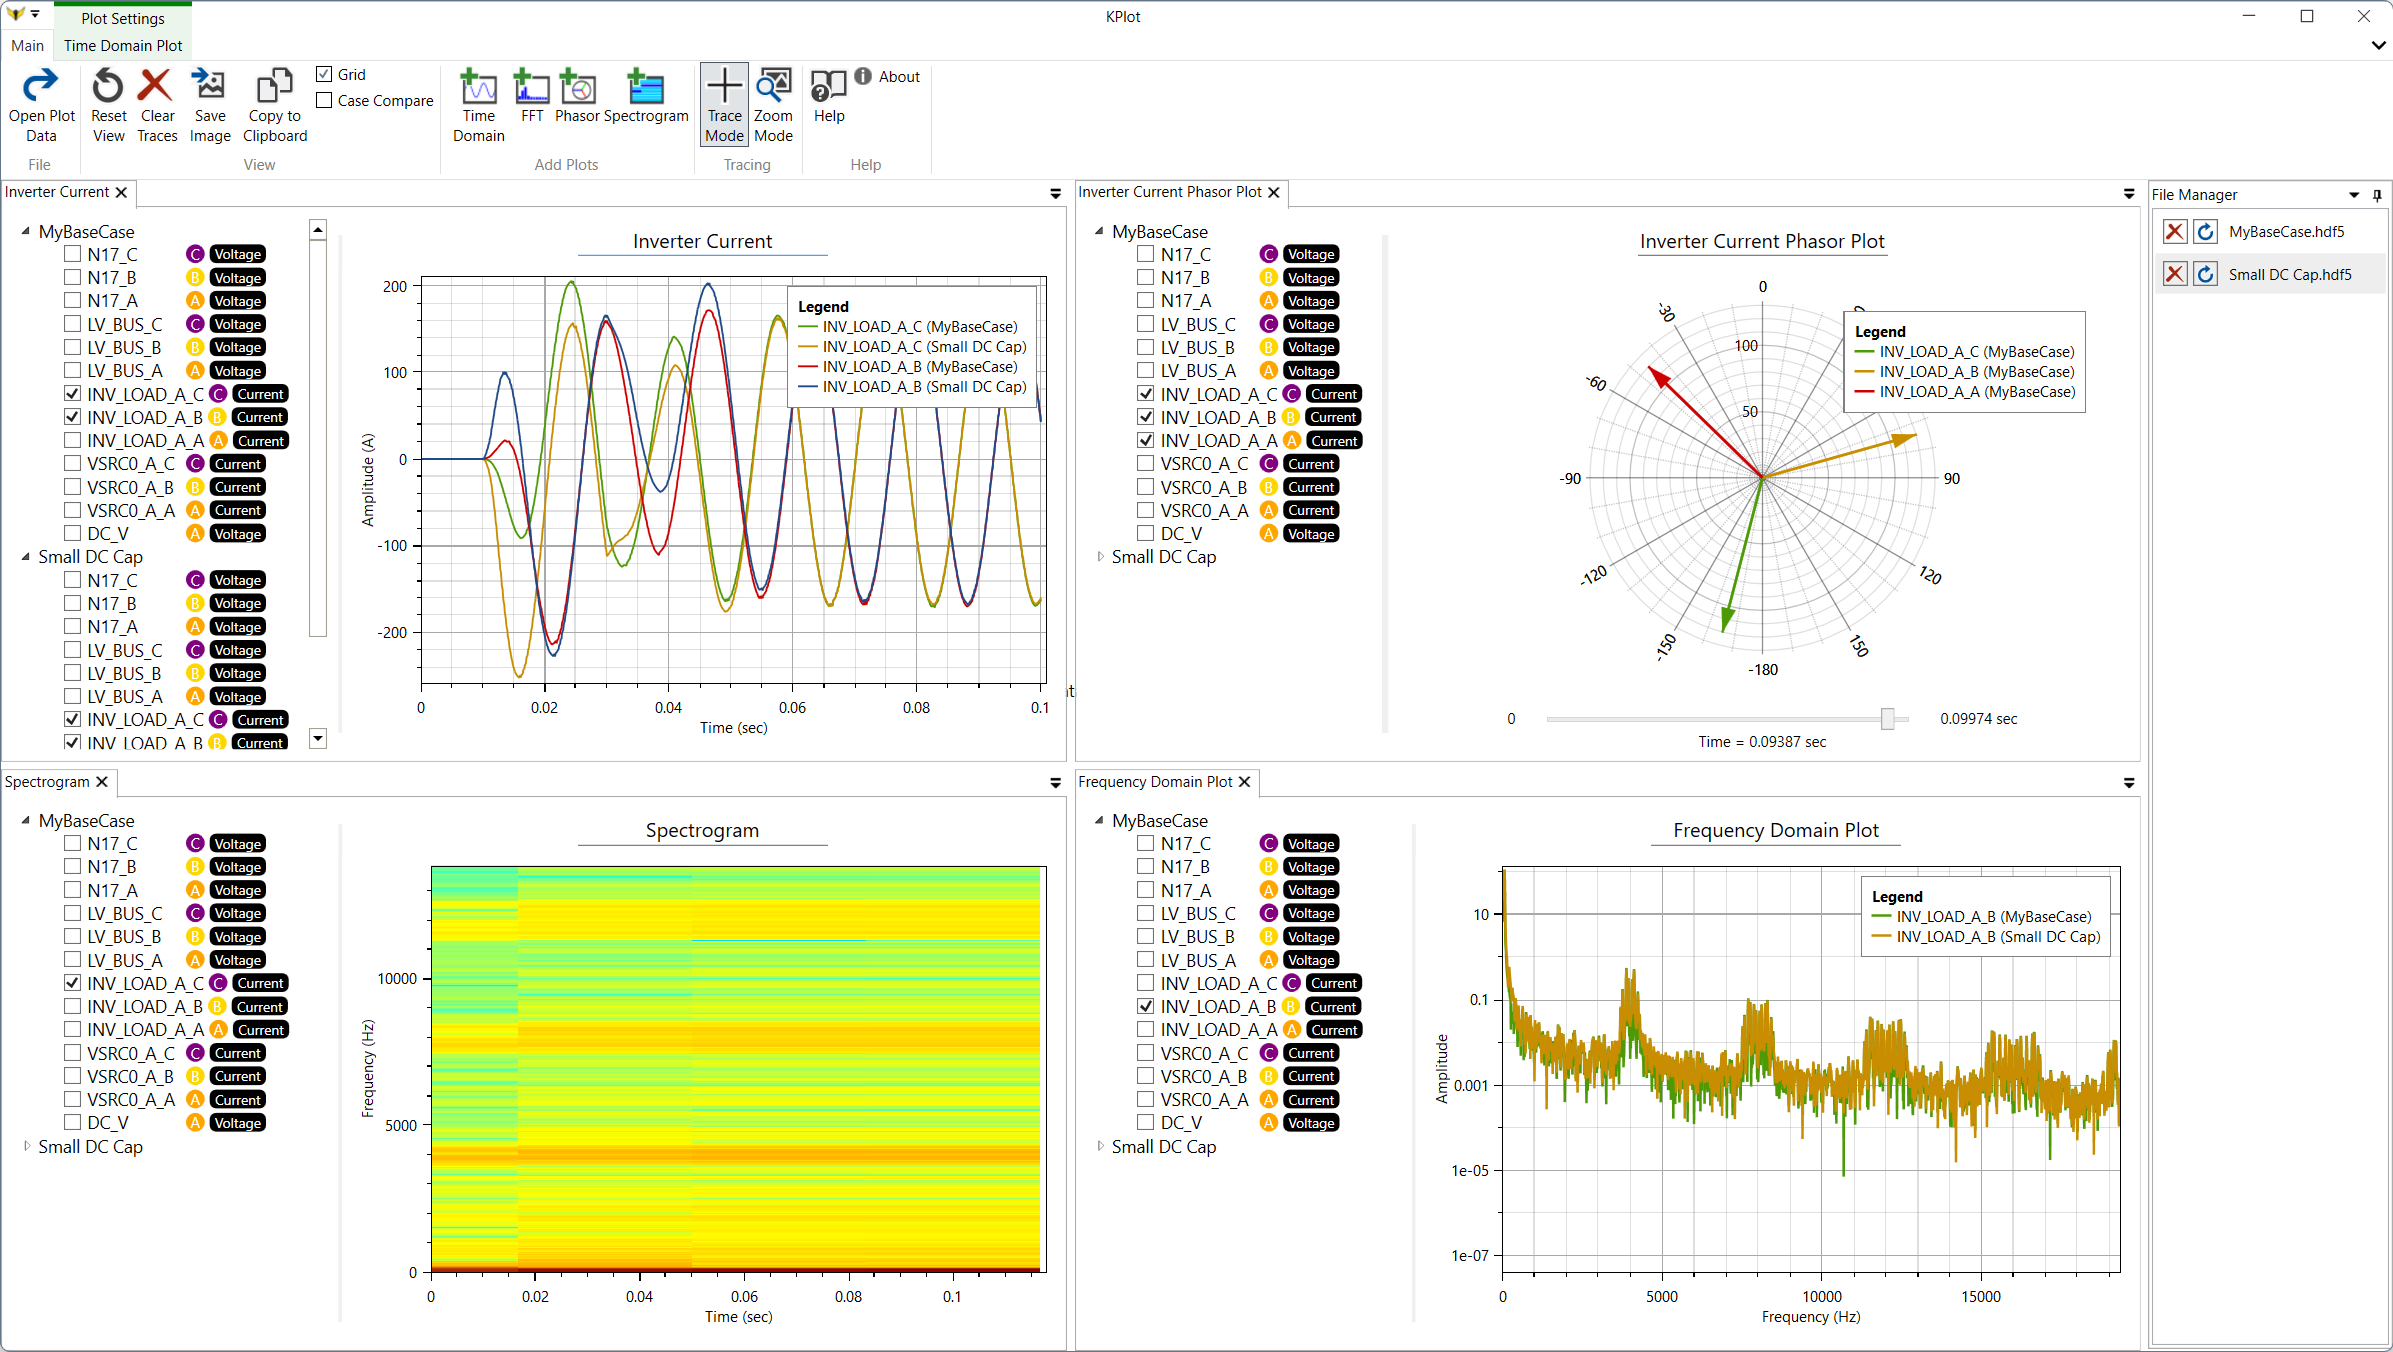
There are four types of plots available in KPlot:
Time Domain : Plot a signal versus time. The time vector is calculated using the “TimeStep” attribute in the HDF5 file.
Frequency Domain (FFT) : Use a fast fourier transform to plot a trace in the frequency domain. Configurable parameters include FFT Window, Plot Type, and Normalization. Amplitude and Phase may be plotted.
Phasor : Plot phasor arrows on a polar plot. Phasors are calculated on a per-cycle basis, and the slider at the bottom of the plot window can be used to scrub between the beginning and end of the simulation. There are two ways to plot phasors in KPlot:
Using the plot tree on the left: This will calculate a phasor value from the sinusoidal trace you select and plot it. The base frequency of the phasor will be assumed to be the value specified in the SystemFrequency attribute in the HDF5 file.
Using the “Create Phasor from Complex” button from the ribbon: This will prompt you for the real and imaginary components to interpret as a phasor. This is useful for plotting outputs from the “Phasor” blocks in Kestrel EMT or other software.
Spectrogram : Plot frequency versus time. Only one trace may be plotted at a time. Values are reported in decibels (dB).
Create a new plot by clicking one of the buttons in the Add Plots group in the ribbon. All four plots are shown in the figure below:
KPlot Hotkeys
Control+Mouse Wheel - Zoom In/Out
T - Switch to Tracing Mode
Z - Switch to Zoom Mode
Left Mouse : Trace or Zoom
Right Mouse : Reset Zoom
Middle Mouse : Zoom to Box
File Formatting
KPLOT supports HDF5 (.hdf5, .h5), PSCAD (.inf) Siemens/PTI PSS/E (.out), Comma-Separated Values (.csv), PSCAD (.inf), and KGRID Raw Data (.raw). HDF5 files and CSV files can vary in formatting, so the format specification is below.
HDF5 File Format
For more information about the format, visit the HDF Group’s site at: https://www.hdfgroup.org/. Analyzing results in HDF5 files is easily done using the built in KPlot tool, the h5py library in Python, or the h5read function in MATLAB.
HDF5 is a hierarchical format. Simulation data is saved in nested groups. The root group name(s) correspond to the “Run Name” (“Default”) in the Kestrel simulation. For each simulation trace (e.g. each monitored voltage, current, or math quantity), a dataset is saved. For instance, if you execute a simulation with three monitored voltage nodes N1, N2, and N3, with the “Run Name” set to “Default”, the dataset structure inside the HDF5 will look like this:
Default
|	N1
|	N2
|	N3
Each dataset, N1, N2, and N3 will also have some helpful attributes attached to it. Available attributes include:
Channel : If part of a multi-phase set, this is the index of that channel (i.e. which phase it is). Optional.
Name : The name of the channel. This can sometimes differ from the name of the dataset of the HDF5 file. For instance if the three-phase voltage node “N1” is monitored in the simulation, three datasets will be created in the HDF5 file: N1_A, N1_B, and N1_C. Optional.
Quantity : What type of node was monitored, e.g. “Voltage” or “Math”. Optional.
SystemFrequency : System frequency in Hz. This is used for RMS and phasor Calculations within KPlot
Unit : e.g. V for Volts or A for Amps. Optional.
TimeStep : Simulation timestep, in seconds. Optional.
nChannelsAvailable : Number of channels/phases if the quantity is part of a multiple phase set. Optional.
CSV File Format
For KPlot to properly load the CSV file, the file must be formatted in the following way:
The file is comma delimited
There is only one header row
All rows (besides the header row) should be comma separated numeric values. No string values are allowed.
The column you want to represent the X axis should be called “time” or “t” (case insensitive).
All columns must have the same number of rows.