Kestrel EMT 2026.7 Released
A new version of Kestrel EMT and KPlot has been published. See the changes below or visit the Kestrel EMT page for more information.
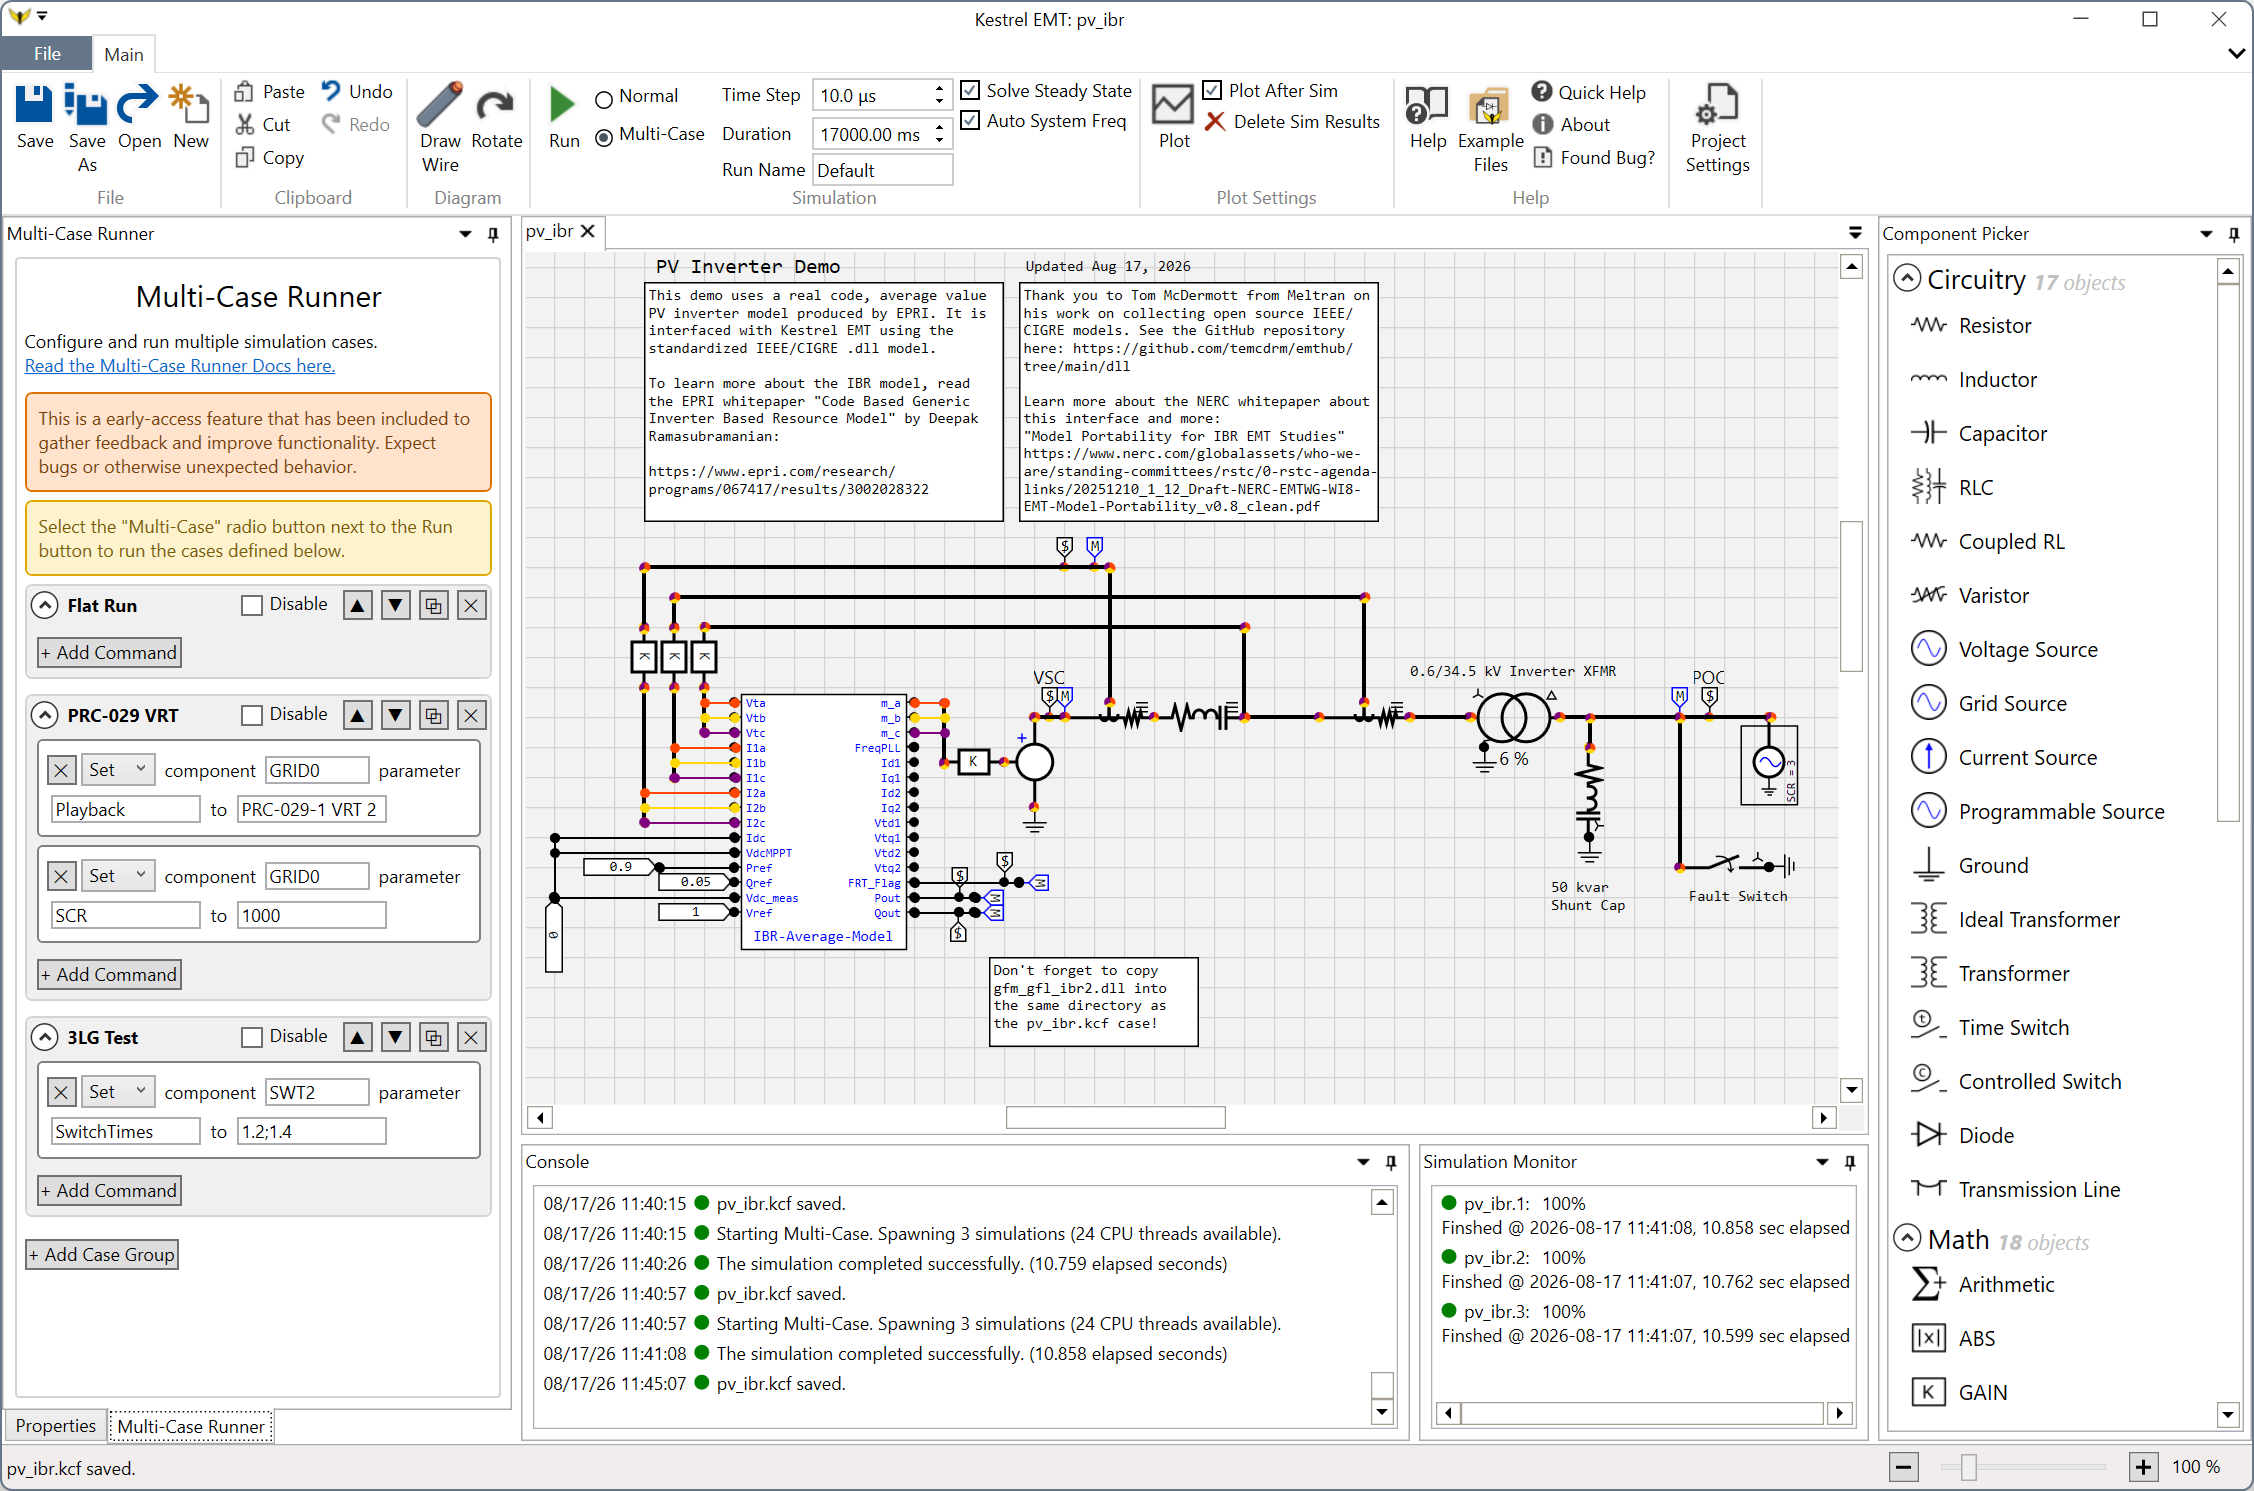
Key features are the new Multi-Case Runner for parallel processing of cases. Example files are provided for a IBR based test case:
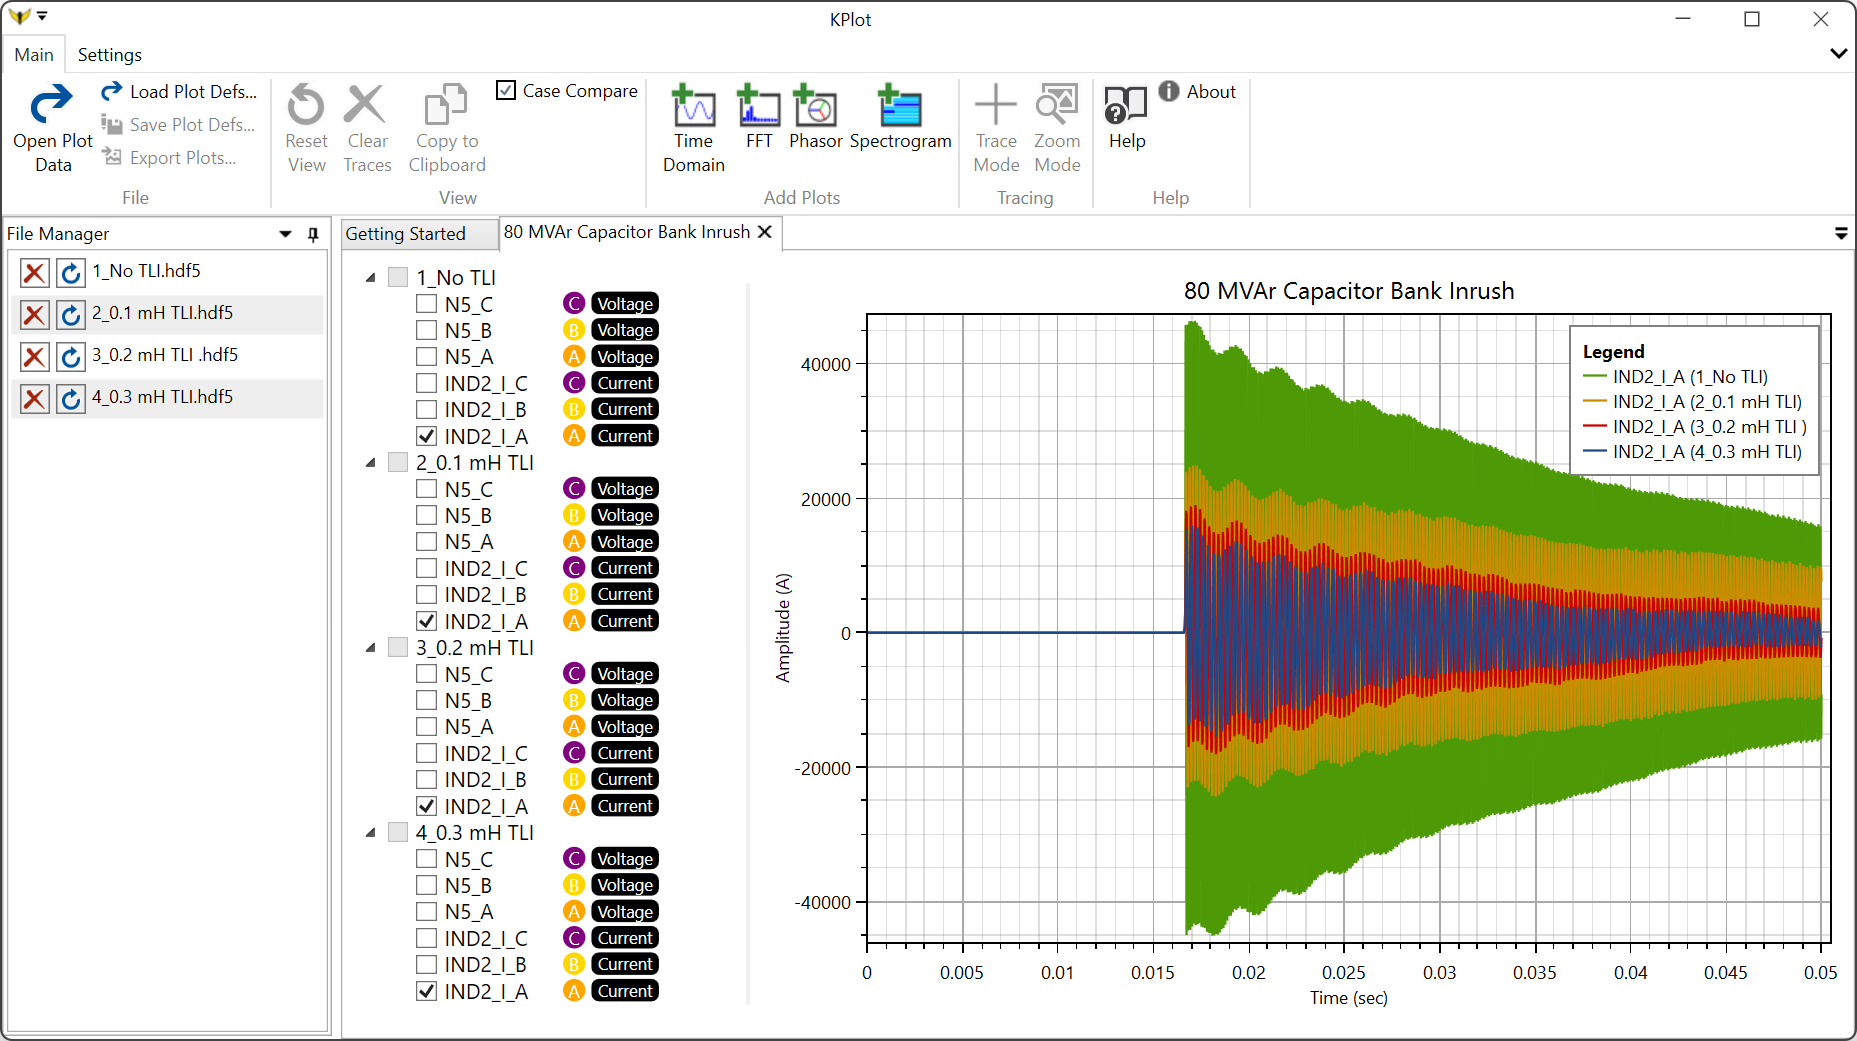
The Multi-Case Runner is also useful for station studies, such transient limiting inductor (TLI) sizing for back-to-back capacitor switching:
The feature is in very early development, but we’d appreciate any feedback during this testing period.
Learn more about the changes below:
August 17, 2026
Kestrel EMT
- Added Multi-Case Runner - New (VERY preliminary) feature! Configure multiple cases and execute them in parallel. This is useful for model quality assessments, model validation, and design evaluations as part of generation interconnection studies (e.g. IEEE Std 2800.2 and PRC-029-1). This feature preliminary, and will change significantly in subsequent releases. Read the Multi-Case Runner section in the Kestrel EMT documentation to understand its limitations.
- Improved Steady State engine to include an approximation for DC sources.
- Fixed bug that prevented HDF5 file output for very large timesteps.
- Fixed localization issue that prevented simulations from running on machines that use the comma separator for decimals.
- Updated the EPRI IEEE/CIGRE DLL inverter model test case pv_ibr.kcf to implement some basic Multi-Case tests
- Added back to back capacitor switching example case, cap_sw.kcf
KPlot
- Added Scaling feature for Siemens PTI PSS/E .out files for the FREQ, VARS, and POWR quantities. You may now specify a MVA base and system frequency and those quantities will be scaled automatically.
- Added support for “timestamp_epoch” as a valid x-axis column name for plotting CSV files. This is to support KGRID waveform/phasor data exports.
- Removed origin (0,0) point from CSVs, this improves the plotting experience when the first point of the x-axis data isn’t 0.
- Invalid numerical data in CSV files is now ignored instead of causing the plot to fail.